knowledge base
Analytics Tab
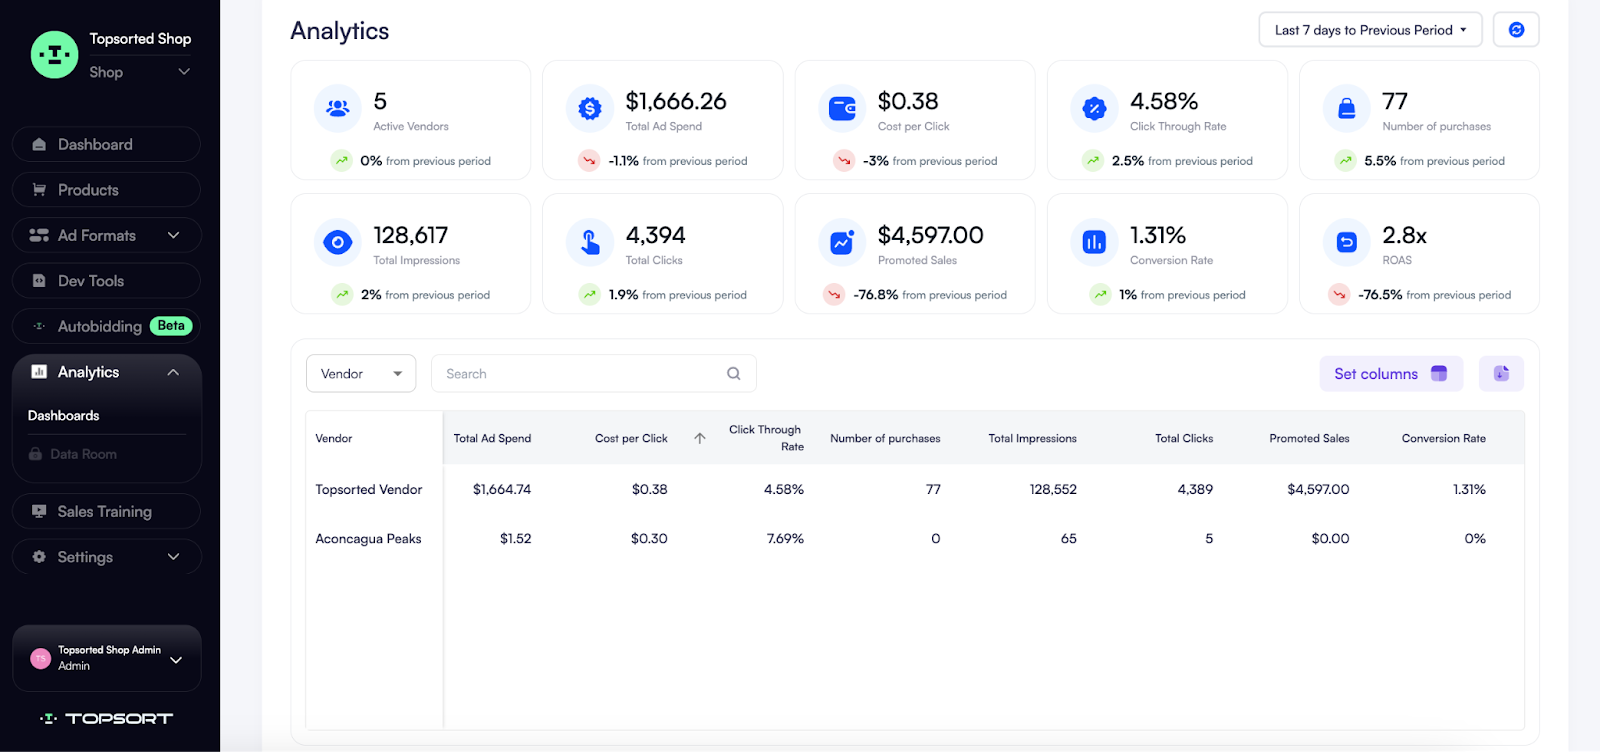
The Analytics Tab is a powerful tool to unlock the power of data-driven advertising. In Analytics Tab, you can monitor and analyze real-time KPIs to gain insights needed for advertising success.
Compare Time Periods

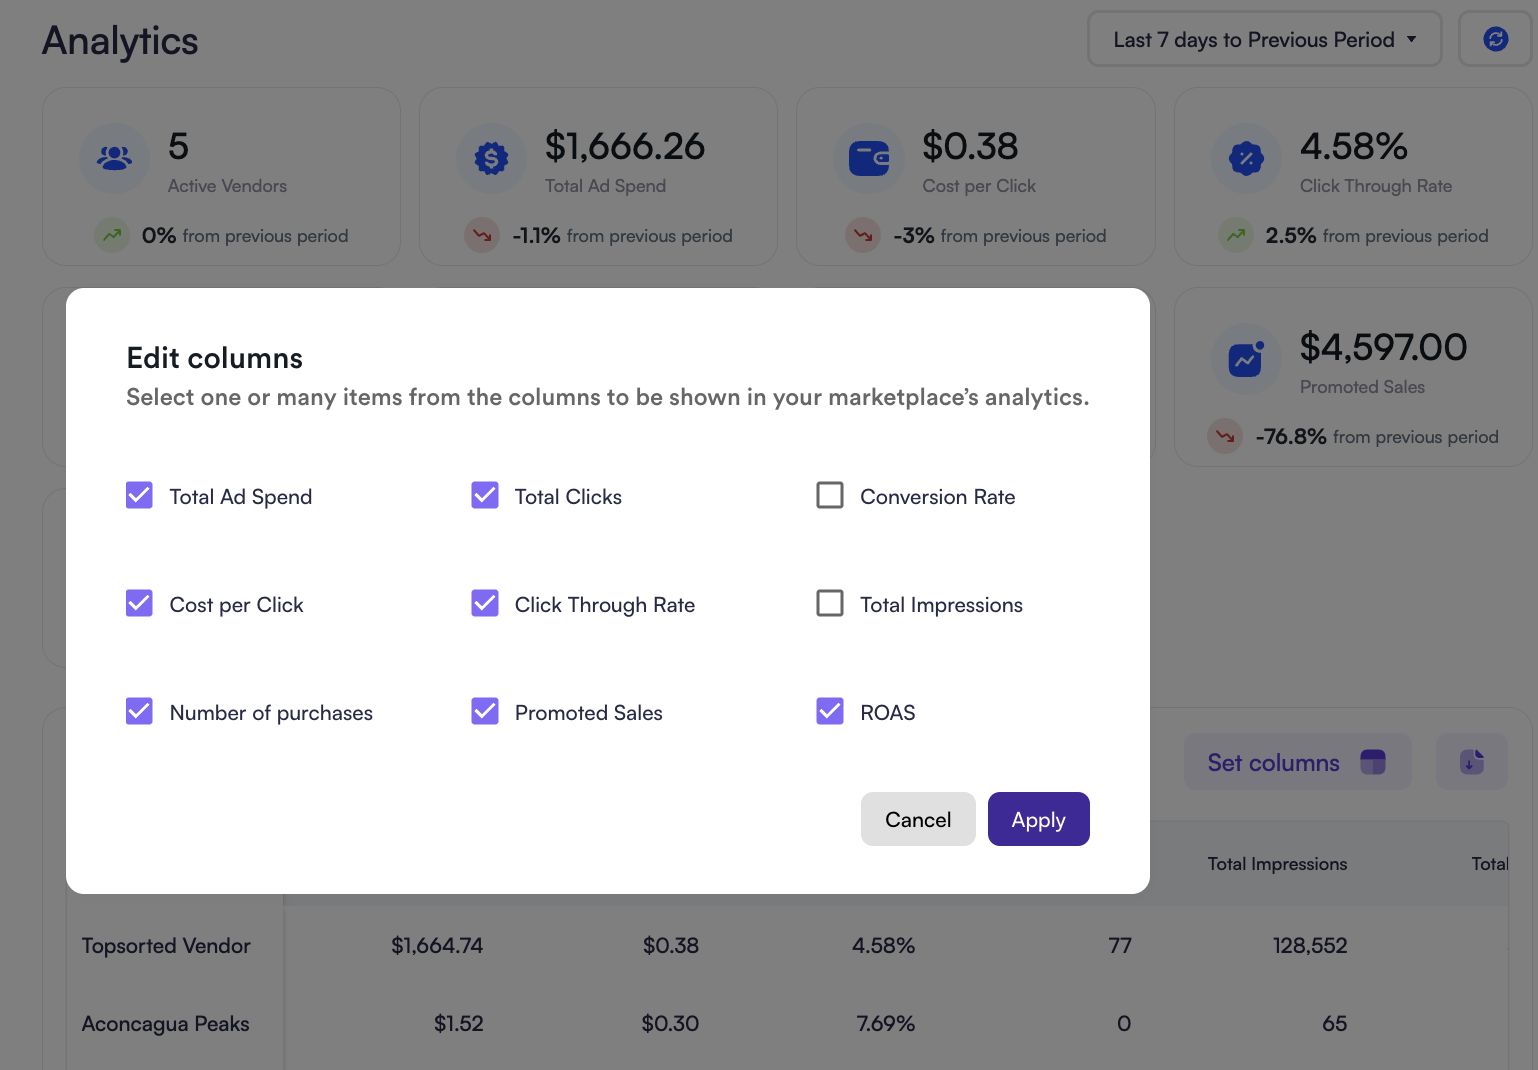
Customize Specific Metrics
You can customize your view by selecting specific items to focus on, choose the date range for comparison, and export this data.

Glossary of Ad KPIs
| Metrics | Details |
|---|---|
| Vendors advertising | Number of vendors (brands) that you have on your marketplace that are currently running active campaigns. For example, if the number is 3563, your marketplace has 3563 vendors who are running at least one campaign |
| Total Ad Spend | Total amount of money that has been spent by vendors on native ads across your platform in the time frame displayed on the top right. This is not the amount of money you will receive in fees. You will receive a percentage of this from each vendor. |
| CPC (Cost per click) | This is the average cost-per-click across Topsort-powered ads on your marketplace in a given time period. This is the average amount we charge per click. We charge you at most once per customer per session. That is, if a customer in their product discovery clicks on your product multiple times within one search session, we charge only for the first click. |
| CTR (Click through rate) | This is the fraction of times a customer clicks on a promoted ad when they see it. For example, if out of your 100 impressions 20 customers click on your product the CTR is 20%. |
| Total Impressions | Every time a customer sees your product in a premium placement, we count it as one impression. |
| Total Clicks | This is the total number of times that a Topsort-powered ad has been clicked. |
| Promoted Sales | This is a metric that shows the total number of products that were sold through Topsort powered ads. This dashboard only tracks information related to Topsort powered advertisements, not general site information like total sales. |
| Conversion Rate | Shown as a percentage, the conversion rate is the number of conversions divided by the total number of impressions in a given period. |
| ROAS (Return on Ad Spend) | How much revenue has a vendor’s ads generated per dollar that has been spent on ads. For example, if you spend $50 on your ads and that generates $2500 in sales, your ROAS is 50x. |